Testing a Palette for Color Blindness
Testing a palette for color blindness takes three checks: simulate the palette under the three main types of color vision deficiency (protanopia, deuteranopia, tritanopia); inspect the specific color pairs that carry meaning — success against error, one chart series against the next; and fix any pair that collapses by separating lightness or adding a second signal, not by hunting for “safe” hues.
The stakes are ordinary, not niche: red–green deficiency in some form affects roughly 8 % of men, so a product with any real audience has affected users this week. The encouraging part is structural. What breaks under color blindness is hue distinction, not lightness perception — so a palette built with deliberate lightness structure, the discipline running through our color scales guide, is most of the way safe before testing begins.
What are the main types of color blindness?
Human color vision rests on three cone types, tuned to long, medium and short wavelengths. Color vision deficiency means one type is absent or shifted, and the taxonomy follows from which one.
Protanopia (long-wavelength cones absent) and deuteranopia (medium-wavelength cones absent) both collapse the red–green axis, which is why they travel together under the label red–green color blindness — the common form, and the one worth designing for first. Tritanopia (short-wavelength cones absent) collapses the blue–yellow axis instead; it is rare — well under one percent — and unlike the red–green forms it affects men and women at similar rates. The full taxonomy includes milder anomalous forms of each, where the cone is shifted rather than missing; the dichromatic versions above are the strong end of the spectrum, and the standard test targets.
That is as much physiology as palette work needs. The practical takeaway is one sentence: certain hue pairs become one hue, per type.
What actually breaks in a palette — and what doesn’t?
What breaks is hue-pair distinction. Red versus green status dots, a red-to-green diverging chart, two categorical series that differ only in hue, olive versus orange tags — under deuteranopia these converge toward the same brownish family, and the meaning they carried evaporates.
What does not break is lightness structure. Color-blind viewers perceive lightness differences essentially as everyone else does — a light color and a dark color stay a light color and a dark color under every type of CVD. Text hierarchy on a well-ordered ramp, borders against surfaces, hover steps: intact.
This asymmetry is the design insight of the whole topic: a palette whose meaning survives grayscale survives most color blindness, because grayscale is the harsher version of the same stress — it deletes all hue, while CVD deletes one axis of it. Meaning carried by lightness travels through both. Meaning carried by hue alone is the only thing at risk, which is why testing concentrates on the handful of pairs where hue alone does semantic work.
How do you simulate the deficiencies?
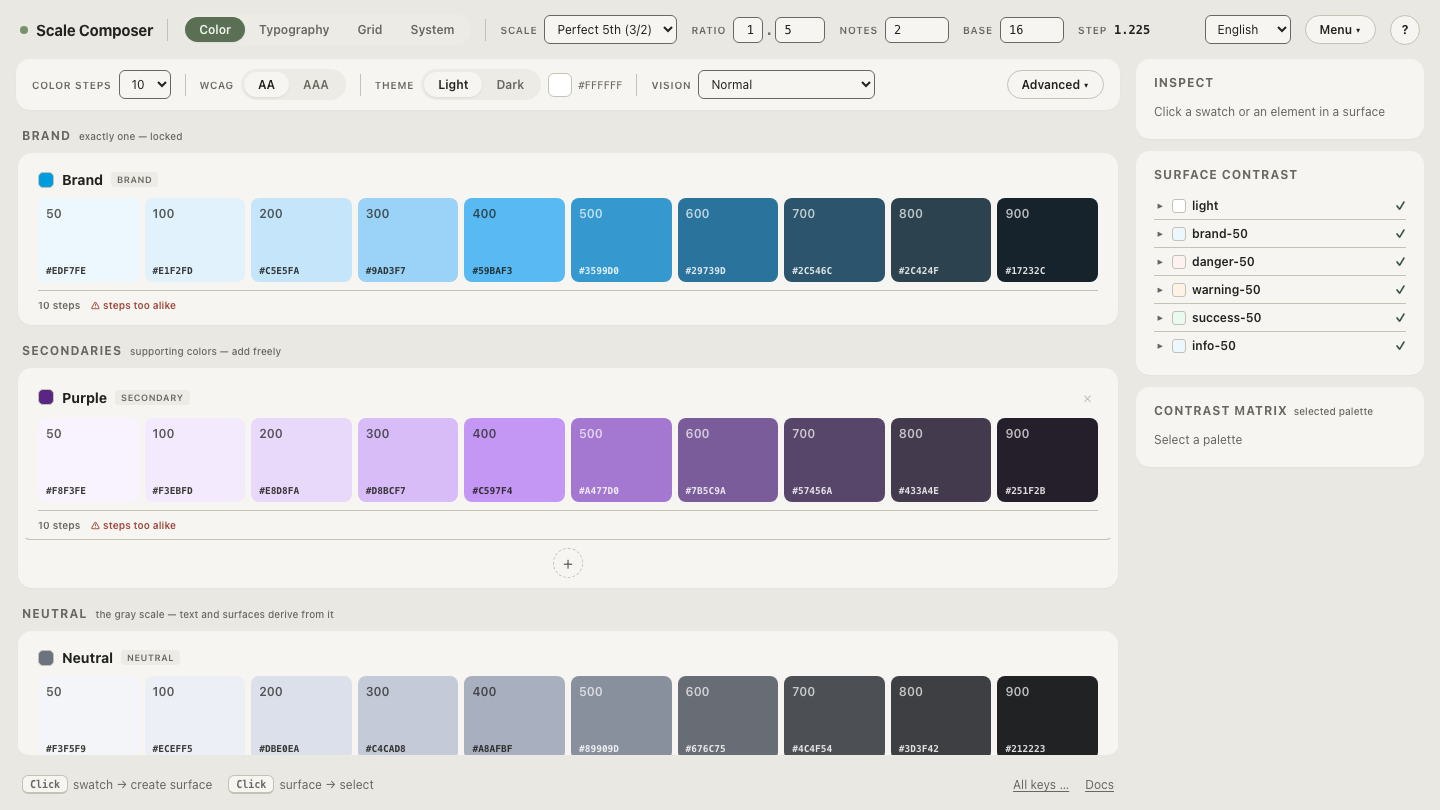
By rendering the palette through a simulation, and reading it deliberately. Scale Composer’s Vision selector re-renders the entire palette through protanopia, deuteranopia or tritanopia using the Machado matrices — a standard research model of dichromatic vision. It is a pure preview: nothing in the palette is altered, and switching back restores normal rendering. One honest caveat belongs up front: simulation matrices approximate typical deficiency of each type. Real color vision deficiency is a spectrum of severities, so the preview tells you a pair is risky — it cannot certify how any individual sees it.
Read the simulation the way the failure happens: not “does the palette still look nice” but “which meaning-bearing pairs just merged”. Flip through the three types and watch the functional colors and any categorical series — those are where hue does unassisted semantic work.
Open a palette under the deuteranopia preview in Scale Composer — the Vision selector re-rendering every ramp and role, with the success/error pair doing exactly what the next section shows in numbers.
What does a failing pair look like in numbers?
Take a success green and an error red at nearly the same lightness — a common accident, since both are mid-strength UI colors:
| Role | Value | Normal | Deuteranopia |
|---|---|---|---|
| success | oklch(0.64 0.15 150) | ≈#36A558 | ≈#988D5D |
| error | oklch(0.62 0.19 25) | ≈#E24947 | ≈#9A8C42 |
Under deuteranopia both land in the same olive-tan family, and their simulated lightness comes out at ≈0.64 apiece — the pair is, for practical purposes, one color. A status dot in this palette says nothing.
Now separate the pair by lightness instead — lift the green, sink the red, 0.15 L between them:
| Role | Value | Normal | Deuteranopia |
|---|---|---|---|
| success | oklch(0.72 0.15 150) | ≈#53BE70 | ≈#B1A575 |
| error | oklch(0.57 0.19 25) | ≈#D03739 | ≈#8A7D34 |
The hues still converge — that cannot be prevented — but the simulated pair now sits ≈0.13 apart in lightness: one clearly light, one clearly dark, distinguishable at a glance. The meaning moved from the channel that fails to the channel that doesn’t.
How do you fix a pair that collapses?
In order of reliability.
Separate lightness first. As the tables show, it is the fix that survives every deficiency type — and grayscale too. On generated ramps it is also cheap: assign the two roles to different steps rather than reshaping any hue.
Add a second signal. An icon in the status dot, a label, a pattern in the chart fill, position. Color then carries redundant meaning instead of sole meaning — the principle accessibility guidance phrases as never using color alone.
Hue-hunt last. Swapping to a “CVD-safe” hue pair can rescue exactly two colors, but it scales poorly — a six-series chart cannot be hue-hunted into safety across all three deficiency types, while lightness ordering and patterned fills scale as far as you need.
The test is quick enough to run on every palette, not just the suspicious ones. Run the functional check on your own palette — load it, switch Vision to deuteranopia, and look at success against error before anything else. If that pair holds, you have caught the failure that ships most often; if it merges, you now know which of the two fixes above to reach for.