Auditing an Existing Brand Palette
Before reading further, run the experiment this article is built on. Collect
your brand’s five most recent touchpoints — the website, the app, the latest
social post, the newest sales deck, a photo of the last printed piece — and
point a color picker at the “same” brand blue
in each. A representative
readout: #2563EB, #2E6BF0, #1D53C9, #3B82F6, #2A62D9. One intended
color; five actual ones.
A brand color audit is a cross-surface inventory of what a brand’s colors actually are, compared with what they are meant to be: collect the real values from the brand book, website, app, templates, decks and printed material, sort the spread into accidental drift and deliberate forks, and deliver a canonical value, a system derived from it, and a mapping table that gives every found value a replacement or a blessing. How to run that audit — and how to read what it finds — is the subject of this article, part of our brand colors guide.
What surfaces does a brand color audit cover?
All of them — breadth is the defining feature. The color pass borrows its scope from the broader brand audit: everything a customer or employee meets counts, not only what the design team controls. In practice the collection list looks like this: the brand book’s stated value; the website’s actual rendered values; the app’s; the social templates sitting in whoever-runs-Instagram’s account; the sales deck the whole company presents from; email signatures and newsletter templates; and the printed material, photographed. A phone photo is enough for print — you are not measuring the ink, you are catching the divergence.
One neighboring discipline is worth naming and setting aside: inside a single codebase, the same exercise becomes an engineering migration — grep the stylesheets, cluster the values, transition through tokens — and that workflow has its own article in our color-scales guide. This audit is its brand-wide counterpart: fewer values per surface, many more surfaces, and owners who mostly aren’t developers.
What do the findings usually look like?
Nearly always the same shape: one intended color, many actual colors, and no one decision behind the spread. Nobody chose five blues. Each value is a local approximation made from the nearest artifact — the deck matched a compressed logo file, the social template shipped with a default nobody reconciled, the site was rebuilt from a screenshot of the old site. The count itself is not the alarming part; audits of established brands commonly turn up a handful of variants per core color. The alarming part is that no value in the set can say why it, rather than its neighbors, is the real one.
How do you tell drift from a deliberate fork?
By whether the difference has a story.
Drift is accumulated approximation: an eyedropper pick of a JPEG, a re-type from memory, a template default. Each instance is harmless — most are individually indistinguishable from the intended color — but they are corrosive in sum, because every future surface copies from an existing one, and drift copies drift. Drift has no author and no reason; it is simply what happens when no canonical value is reachable at the moment of need.
A fork is a deliberate adjustment, and it carries information. The dark blue the app uses because white text failed its contrast check on the real blue is not an error to revert — it is a finding to learn from: the brand color, as specified, cannot do one of the jobs the product needs. A fork has an author and a story, which is why the audit’s method at this step is conversation, not correction. Ask before overwriting.
What does the worked audit look like?
Reading the five values from the opening experiment against the brand book’s
#2563EB:
| Where | Value found | Diagnosis | Verdict |
|---|---|---|---|
| Brand book | #2563EB | the intended color | canonical seed |
| Website | #2E6BF0 | slightly lighter and brighter — rebuilt from a JPEG of the logo | drift → replace with brand-500 |
| App header | #1D53C9 | visibly darker — adjusted because white text failed contrast on the real blue | fork → bless as brand-600 |
| Social template | #3B82F6 | a template-tool default, never reconciled | drift → replace with brand-500 |
| Sales deck | #2A62D9 | eyedropper pick from a compressed logo | drift → replace with brand-500 |
Three of the four deviations dissolve into one canonical value. The fourth is the audit’s best kind of outcome: an undocumented fix that graduates into a documented rule. The app’s darker blue was answering a real question — what does our blue look like when it has to hold white text? — and the answer now gets a name instead of living in one team’s stylesheet.
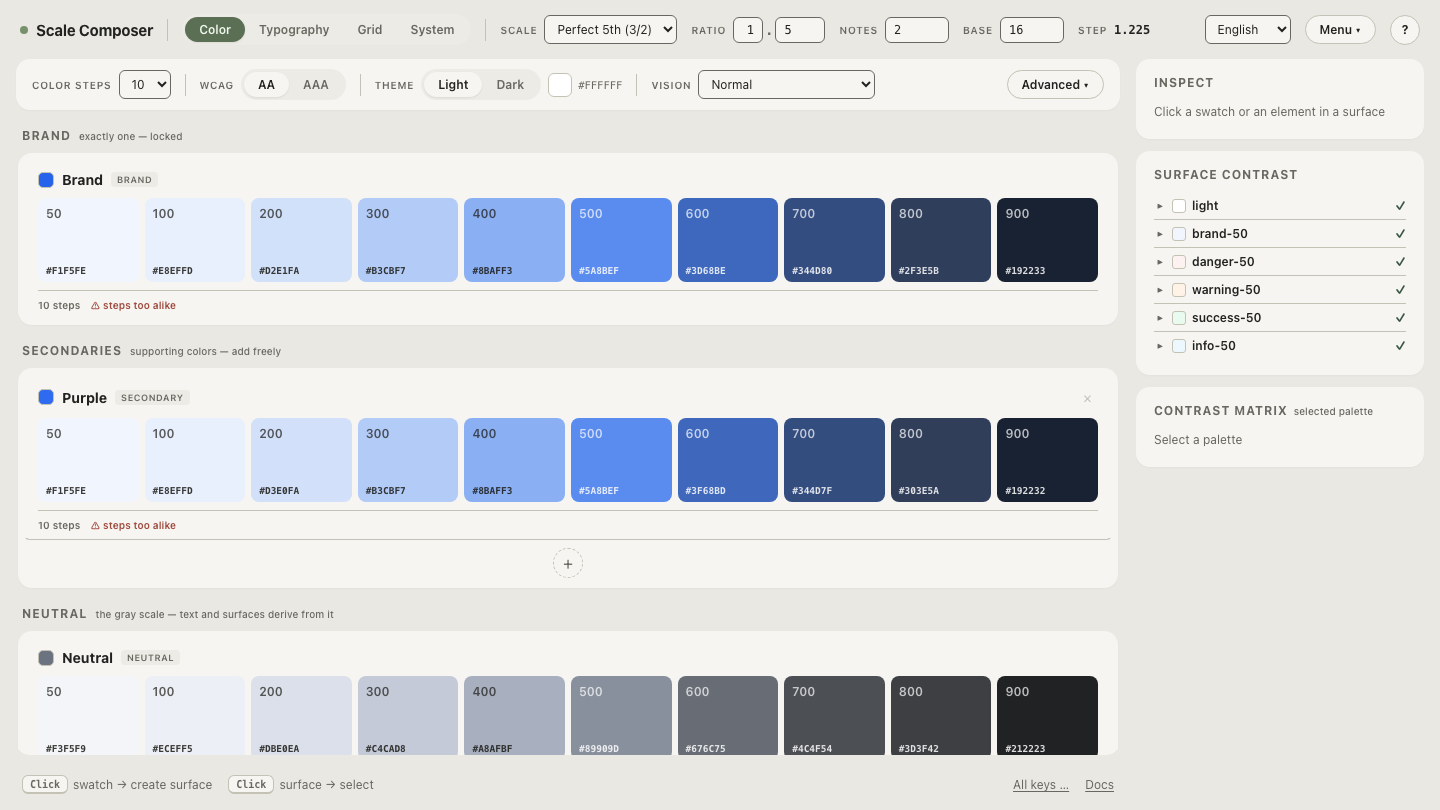
Open the found values next to the generated ramp in the Scale Composer — the audit’s five blues imported alongside the system derived from the canonical seed, with the near-misses and the genuine fork visible at a glance.
What should the audit deliver?
Three artifacts, in dependency order:
- A canonical value — one, named, written down, with the losing variants explicitly retired. An approximation that isn’t marked obsolete will be found and reused.
- A derived system — the tints, shades, text pairings and functional colors generated from the canonical value, so the next surface has an official answer at every point where it would otherwise improvise. This is what makes the canonical value hold: most drift happens because the needed variant didn’t exist, not because anyone doubted the original.
- A mapping table — every found value pointed at its replacement or its blessing, like the one above. The table is what turns the audit from an opinion into a work order.
Why do audits that end in a PDF restart the drift?
Because people approximate from the nearest artifact — that is the mechanism that produced the spread, and it doesn’t stop operating when the audit ships. A PDF is one more artifact: accurate the day it is exported, then screenshotted, eyedroppered and half-remembered exactly like the brand book before it. Tokens are a different kind of artifact — the kind tools consume directly. When the website, the app and the templates read the same token source, the next hover state comes from the system rather than from someone’s eyedropper, and the audit’s finding stays fixed instead of decaying. An audit that ends in a document restarts the cycle it measured; one that ends in tokens ends it.
Where do you start?
With the canonical value — everything else in the deliverable derives from it. Generate the canonical ramp and map your found values onto it — seed it with your brand book’s color, and the system that replaces the spread comes out the other side.